Room sizing for studios
Over the years, people have suggested certain ratios of room dimensions that minimise the distortion caused by low frequency room modes. These “golden ratios”, however, are not necessarily the best dimensions to choose for a room and below some new best room dimensions are suggested.
These web pages gives some more detailed numerical results from an Audio Engineering Society journal paper which appeared in June 2004. The journal paper gives more details of the method used and can be downloaded from the AES web site.
Why choose the right room size?
The sound that is heard in a critical listening room is determined by the combined effect of the electronics of the audio system and the physical acoustics of the listening environment. The tonal balance and timbre of a sound can vary significantly depending on the placement of the listener and loudspeaker and the geometry of the room. Indeed, the modal artefacts introduced by the room can be so influential that they dominate the sound. We will concentrate on the design challenges to minimize these artefacts at low frequencies. Consequently, we are concerned with the interaction between the sources, listeners and the room modes.
Modes in small rooms often lead to extended sound decays and uneven frequency responses – often referred to as coloration. Problems arise at low frequencies because of the relatively low modal density. Designers try to overcome the problems of modes by choosing an appropriately proportioned room, by placing the listeners and loudspeakers in suitable positions and by using bass absorbers. Here we will concern ourselves with the first problem, choosing the right room dimensions.
The determination of appropriate source and receiver location is often undertaken by a trial and error process. Although this is a laborious task, it is possible to do. When sources or receivers are moved, the frequency response changes due to the variation in the modal pressure distribution in the room and the changing radiation resistance of the source. By choosing correct positions in the room, it is possible to minimise the audible effects of the modes within a room . As well as considering the modal (steady state) response, others have considered the effects of first order reflections from boundaries. In particular, the first order reflections from the nearest wall boundaries to the source have been considered along with the effect these reflections have on the frequency response (e.g. [1]). A more complete solution using optimization is possible [2].

At low frequencies rooms suffer from modal problems. The figure to the right shows a typical frequency response. Whatever the shape of a room, there will be a low frequency range where modes are rather sparsely spaced in frequency, leading to a poor sound quality. In particular, it is the excessively long sound decays of modes that make them stand out and more audible. While this problem can be solved by damping the modes (by adding absorption), it is best if the room has dimensions that help minimise the modal problems in the first place, because this makes it easier (and cheaper) to treat the modes.
References 1
[1] Loudspeaker and Headphone Handbook” 2nd Edition. Edited by John Borwick. Focus Press, ISBN 0-240-51371-1.
[2] T J Cox and P D’Antonio. Room Optimizer: A Computer Program to Optimize the Placement of Listener, Loudspeakers, Acoustical Surface Treatment, and Room Dimensions in Critical Listening Rooms”, 103rd Convention of the Audio Engineering Society, Preprint 4555, Paper H-6, New York (September 1997).
Methods for choosing correct dimensions
These web pages gives some more detailed numerical results from an Audio Engineering Society journal paper which appeared in June 2004. The journal paper gives more details of the method used and can be downloaded from the AES web site.
Many optimum room ratios have been suggested over the years to minimize coloration. Essentially these methods try to avoid degenerate modes, where multiple modal frequencies fall within a small bandwidth, and the corollary of bandwidths with absences of modes. The starting point for these previous methods is usually the equation defining the modal frequencies within a rigid rectangular enclosure. Often the best dimensions are given in terms of the ratios to the smallest room dimension.
Bolt [1] investigated the average modal spacing to try and achieve evenly spaced modes, but using the average mode spacing is not ideal, and the standard deviation of the mode spacing is a better measure. Ratios of 2:3:5 and 1: 21/3:41/3 (1:1.26:1.59) were suggested, but Bolt also noted that there is a broad area over which the average modal spacing criterion is acceptable. (Note, this later ratio appears to be often rounded to the commonly quoted figures of 1:1.25:1.6).
Gilford [2] discusses a looser methodology whereby the modal frequencies are calculated and listed. The designer then looks for groupings and absences assuming a modal bandwidth of about 20Hz. The dimensions are adjusted and a recalculation is carried out until a satisfactorily even distribution is achieved. This is a cumbersome process. Gilford also states that the 2:3:5 ratio suggested by Bolt is no longer popular and that the axial modes need to be given a stronger weighting in calculations as they cause more problems.
Louden [3] calculated the modal distribution for a large number of room ratios and published a list of preferred dimensions based on the standard deviation of the intermode spacing to achieve evenly spaced modes. The method produces the well known room ratio of 1:1.4:1.9.
Limitations:
* The work is only applicable to rectangular geometries with rigid surfaces.
* Absorption neglected
* All modes (axial, tangential, oblique) treated the same
Standards and recommendations also stipulate good room ratios for activities such as listening tests and broadcasting and recent versions have drawn on work by Walker [4]. Walker states that the aim of the regulations is to avoid the worse cases, rather than to provide proscriptive optimum ratios. Consequently, the recommendations cover a wide range of room proportions.
In addition, it is stipulated that ratios of Lx, Ly and Lz which are within about 5% of integer values should also be avoided. The British Standards Institute and International Electrotechnical Commission give slightly different criteria.
New Method
The new method has been produced based on producing the flattest possible modal frequency response for the room to determine the best room size. It uses a computer algorithm to search for best solutions [5]. Furthermore, the algorithm has been further advanced since reference [5] to look at room dimensions which are robust to changes in room size due to construction tolerances in terms of the room size and the properties of the construction material (the details of the analysis and method have been submitted to the Journal of the Audio Engineering Society..
References 2
[1] R.H.Bolt. Note on the normal frequency statistics in rectangular rooms. J.Acoust.Soc.Am. 18(1) 130-133. (1946).
[2] C.L.S.Gilford. The acoustic design of talk studios and listening rooms. J.Audio.Eng.Soc. 27. 17-31. (1979).
[3] M M Louden. Dimension ratios of rectangular rooms with good distribution of eigentones. Acustica. 24. 101-104 (1971).
[4] R. Walker. Optimum Dimension Ratios for Small Rooms. Preprint 4191. 100th Convention of the AES. (5/1996).
[5] Trevor J Cox and Peter D’Antonio. Determining Optimum Room Dimensions for Critical Listening Environments: A New Methodology. Proc 110th Convention AES. paper 5353 (2000)
The best room dimensions found
These web pages gives some more detailed numerical results from an Audio Engineering Society journal paper.
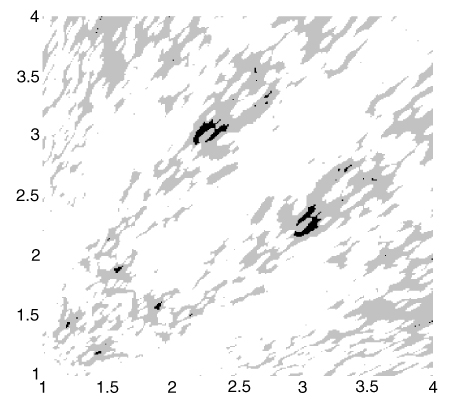
For any particular room volume, it is possible to plot the variation of room quality for bass frequencies with the room ratios [1]. The right figure shows such a plot. Light areas correspond to uneven frequency responses, dark areas correspond to the best room sizes. The main light diagonal line running from the bottom left to top right corresponds to rooms where two of the dimensions are similar, having a square floor plan, and therefore the distribution of the modes is uneven and the figure of merit poor.
Using this type of analysis, it can be shown that there are very few room ratios (about 20 clustered around 1:2.19:3) that can be applied to a range of room volumes (50 – 200 m3). This is because room ratios are generally not scaleable. The ratios robust to room size were:
1: 2.16 : 2.96
1: 2.16 : 2.97
1: 2.16 : 2.98
1: 2.17 : 2.96
1: 2.17 : 2.97
1: 2.17 : 2.98
1: 2.17 : 2.99
1: 2.18 : 2.97
1: 2.18 : 2.98
1: 2.18 : 2.99
1: 2.18 : 3
1: 2.19 : 2.99
1: 2.19 : 3
1: 2.19 : 3.01
1: 2.19 : 3.02
1: 2.2 : 3.01
1: 2.2 : 3.02
1: 2.2 : 3.03
1: 2.21 : 3.02
1: 2.21 : 3.03
1: 2.22 : 3.03
1: 2.22 : 3.04
It is also found that the ratios in the literature are generally found to be poor in this analysis because the ratios are not robust to constructional variations.
Under supplementary data on Research Gate (scroll a long way down the page!) for the research article, there is a spreadsheet that gives a list of the best ratios for the three room sizes tested. The room sizes are shown in the worksheet tabs. It might not be possible to use the best ratios in the above spreadsheet because of building constraints. Consequently, another spreadsheet gives the second best ratios (corresponding to reasonable rooms but not the best, shown light grey in the illustration).
The results are limited to cuboid rooms (rectangular rooms). If your room has slanted surfaces, it will still suffer from modes, but they won’t be well predicted by the algorithm used. Analysis has shown that the algorithm can tolerate a deviation of about 0.6m from a purely cuboid room.
The data is provided as is, and the University accepts no liability for using this data.
References 3
[1] R. Walker. Optimum Dimension Ratios for Small Rooms. Preprint 4191. 100th Convention of the AES. (5/1996).
Re-use of material permitted provided it is clearly labeled “(c) University of Salford, www.salford.ac.uk/computing-science-engineering/research/acoustics”