Getting Started – Performance Visualisation in R

This course is aimed at beginners who have zero coding experience, to provide an introduction to how programming can be used to manipulate and visualise performance data. The programming language used throughout this course is R. R is a popular programming language with a wide range of tools. Specifically, R is great at visualising data. Given the timeframe of this course, I want to you be in the mindset of using R as a tool, rather than learning R itself.
To write any R code, you’re going to need a code editor or Integrated Development Environment, or IDE for short. The IDE we are going to use is RStudio and we’re going to use it through Anaconda. Anaconda will help us with managing the packages we need to run our code. Don’t worry about understanding all this, remember we’re using R as a tool!

Install the Anaconda Envrioment
For this course, we are going to import an environment into Anaconda. You can download the environment from the course files (opens in a new tab).
Launch RStudio
RStudio divides into four panes.
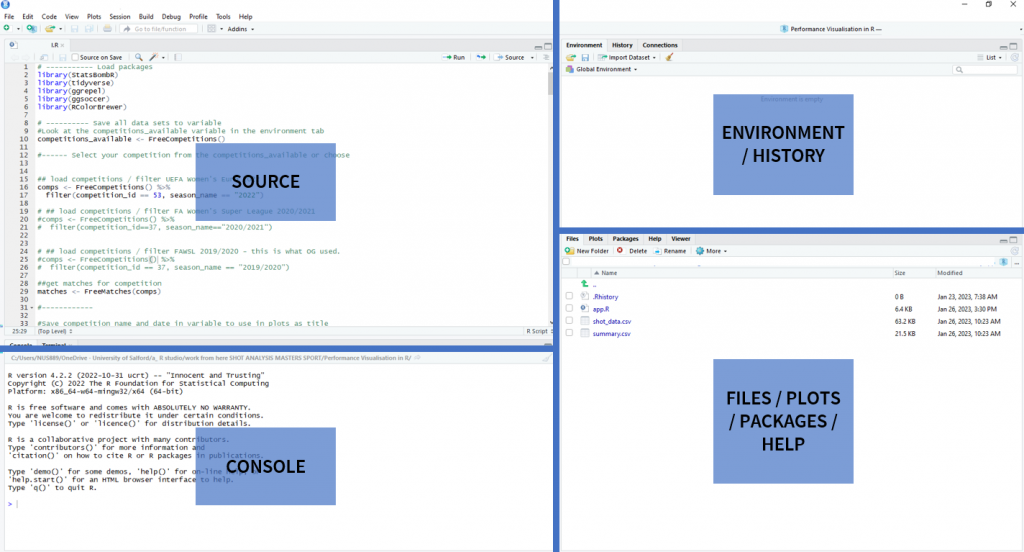
- Source
- Here is where you can write code and save it in a file to use later.
- Console
- The console executes the code you write in source. You can also execute code straight from the console.
- Environment / History
- This pane will display the objects in your environment and display your command history.
- Files / Plots / Packages / Help
- Here you will see your R project file directory, view plots, see packages, and access R help.
It’s just a fancy calculator!
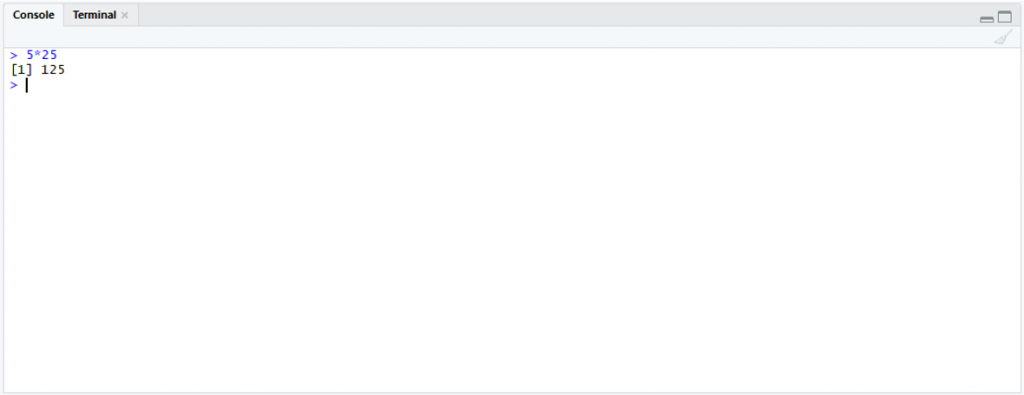
We’re going to break the ice by using RStudio as a calculator. In the console type your numbers and operator then hit enter. Give it a try! Open the ‘Click to reveal‘ to see what you should expect.
| Operator | Description |
|---|---|
| + | Addition |
| – | Subtraction |
| * | Multiplication |
| / | Division |
Click to reveal ⬇ ⎯⎯⎯⎯⎯⎯⎯⎯⎯⎯⎯⎯⎯⎯⎯⎯⎯⎯⎯⎯⎯⎯⎯⎯⎯⎯⎯⎯⎯⎯⎯⎯⎯⎯⎯⎯⎯⎯⎯⎯⎯
Here is what to expect:
Putting the fun in function
Hopefully, that wasn’t that bad! Now let’s introduce you to a classic programming rite of passage. You are going to use the print() function to print “Hello world!” into the console. Copy and paste the code below into the console and press enter.
print("Hello world!")You can replace the “Hello world!” with other words if you like.
print("There are lots of possibilities with R")What happens if you try and print without quotation marks?
print(There are lots of possibilities with R)Click to reveal ⬇ ⎯⎯⎯⎯⎯⎯⎯⎯⎯⎯⎯⎯⎯⎯⎯⎯⎯⎯⎯⎯⎯⎯⎯⎯⎯⎯⎯⎯⎯⎯⎯⎯⎯⎯⎯⎯⎯⎯⎯⎯⎯
Error: unexpected symbol in “print(There are”
Don’t be scared of errors, when programming you’re going to come across a lot of them. The reason this is happening is that, like natural languages, programming languages have syntax. Syntax is a set of rules that you must follow to ensure your code can be interpreted by the computer. If your syntax is not correct, when you try to run your code, you will receive an error. In this case, we are trying to print a character, R will only recognise a character if within quotation marks. Characters (also known as strings) are data types, we’ll talk about them more shortly.
Variables
We don’t have to type directly into the print function what we want to print. We can store that data in a variable. Let’s make a variable and use it with the print() function.
my_var <- "print this please"
print(my_var)
We use the assignment operator <- to store “print this please” into the variable called my_var. Notice how we don’t have to use quotation marks when using the my_var in the print() function. You can change what is stored in my_var without having to change the second line of code.
What happens if you misspell your variable or type a capital letter when there isn’t one?
my_var <- "print this please"
print(My_Var)
Click to reveal ⬇ ⎯⎯⎯⎯⎯⎯⎯⎯⎯⎯⎯⎯⎯⎯⎯⎯⎯⎯⎯⎯⎯⎯⎯⎯⎯⎯⎯⎯⎯⎯⎯⎯⎯⎯⎯⎯⎯⎯⎯⎯⎯
Error in print(My_Var) : object ‘My_Var’ not found
R is case-sensitive and not clever enough to know what you mean if you make a typo!
Data types
Inputting a variable into the class() function will return the data type of that variable. Let’s try this out.
my_var <- "print this please"
class(my_var)
R will tell you that my_var is a character. Let’s try numbers. Numbers do not need quotation marks. If you surround a number with quotation marks, R will treat it as a character.
my_var_number <- 34
print(my_var_number)
class(my_var_number)
Using variables to make more variables
The above code will print 34 and tell you that the data type of my_var_number is numeric. Variables are particularly useful when calculating new metrics, which is something we will be doing a lot of. You can see a basic introduction to this utility by running the following code.
my_var_number <- 34
my_var_number_2 <- 97
my_var_total <- my_var_number + my_var_number_2
print(my_var_total)
# By the way, the hashtag allows you to write comments that aren't excuted!
# You can change the numbers that the the first two variables contain,
# without needing to change anything else in the code variables are
# incredibly useful.
Variables holding more than one value
Up until now, we have been using variables that only hold a single value. Variables can hold many values, for example.
my_var_numbers <- c(1, 2, 3, 4, 5) # The c() here stands for combine, as in
                                   # combine these values.
class(my_var_numbers)
print(my_var_numbers * 10)
Using variables and functions to make more variables
We can also use other functions to manipulate our variables.
my_var_numbers <- c(1, 2, 3, 4, 5)

sum(my_var_numbers) # returns the sum of all the values in the variable
length(my_var_numbers) #returns the how many values are stored in the variable.

# We can use the sum() and length() functions to calculate the mean.
my_var_mean <- sum(my_var_numbers)/length(my_var_numbers)
print("Below is the mean calculated from using the sum() and length() functions.")
print(my_var_mean)

# Alternatively, R does have a mean() function.
print("Below is the mean calculated from the mean() function.")
print(mean(my_var_numbers))
Conditional statements
At the start, we established we are using R as a tool. There is no expectation for you to remember everything we covered today. The importance is understanding the logic. We’re going to finish this Getting Started section by using conditional statements to quantify a variable.
# The shots variable contains values on if a shot resulted in a miss or a goal.
shots <- c("Goal", "Miss", "Miss", "Miss", "Miss", "Goal", "Miss")


# ifelse() is a conditional statment. The code instructs, if the value in shots is "Goal" (indicated by the ==) then add a 1 to the goal_counter variable. Else add a 0 to the goal_counter variable.
goal_counter <- ifelse(shots == "Goal", 1, 0)


# The miss_counter uses the same logic as the goal_counter.
miss_counter <- ifelse(shots == "Miss", 1, 0)

# if you were to print the goal_counter, the output would be
# print(goal_counter)
# 1 0 0 0 0 1 0
# This is because the ifelse() iterates through the shots list.
# Therefore we need to sum the values so they present in the desired format.
goal_counter <- sum(goal_counter)
miss_counter <- sum(miss_counter)

print("This many goals:")
print(goal_counter)
print("This many misses:")
print(miss_counter)
Challenge!
Using the code from the last example. Calculate the percentage of shots that resulted in a goal.
Programming is a lot of problem-solving please do look things up, google is your friend!*
*Other search engines available.
Click to reveal ⬇ ⎯⎯⎯⎯⎯⎯⎯⎯⎯⎯⎯⎯⎯⎯⎯⎯⎯⎯⎯⎯⎯⎯⎯⎯⎯⎯⎯⎯⎯⎯⎯⎯⎯⎯⎯⎯⎯⎯⎯⎯⎯
Don’t worry if your answer is slightly different, there are many ways to achieve the same thing!
# The shots variable contains values on if a shot resulted in a miss or a goal.
shots <- c("Goal", "Miss", "Miss", "Miss", "Miss", "Goal", "Miss")
goal_counter <- ifelse(shots == "Goal", 1, 0)
miss_counter <- ifelse(shots == "Miss", 1, 0)
goal_counter <- sum(goal_counter)
miss_counter <- sum(miss_counter)
# Don't forget there are many ways to calculate this!
percentage_goals <- (goal_counter/length(shots))*100
print("This many goals:")
print(goal_counter)
print("This many misses:")
print(miss_counter)
print("Percentage of goals:")
print(percentage_goals)
# To sense check we can also calculate the % misses
percentage_misses <- (miss_counter/length(shots))*100
# If our calculations are correct then we should get a total of 100
print(percentage_goals + percentage_misses)

Further resources:
If you wish to pursue R independently, I recommend the following online resources to aid you on your learning journey.