Sharpness and booming
Sharpness is a measure of the high frequency content of a sound, the greater the proportion of high frequencies the ‘sharper’ the sound. Where the high frequency content of a sound is important to a product’s quality, than sharpness can be a useful measure. An example of the spectrum of a sharp sound (b) and a less sharp sound (a) is shown in figure 1.
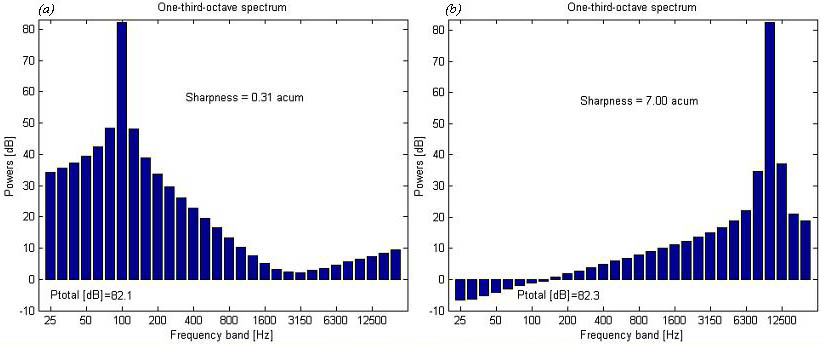
Fig 1. Frequency spectrum and sharpness values of (a) a 100Hz tone and (b) a 10kHz tone.
Click on the links below to hear some examples of sharp sounds and less sharp sounds:
| Sharp sound | Not sharp sound | |
| Broad band noise | High frequency noise | Low frequency noise |
| Tonal noise | High frequency tone | Low frequency tone |
Sharp sound Not sharp sound Broad band noise High frequency noise Low frequency noise Tonal noise High frequency tone Low frequency tone
Sharpness has been used to partially quantify sound quality in examples such as measuring engine noise, and some domestic appliances such as vacuum cleaners and hair dryers. It has also been used in the calculation of a sensory pleasantness metric and an unbiased annoyance metric [1].
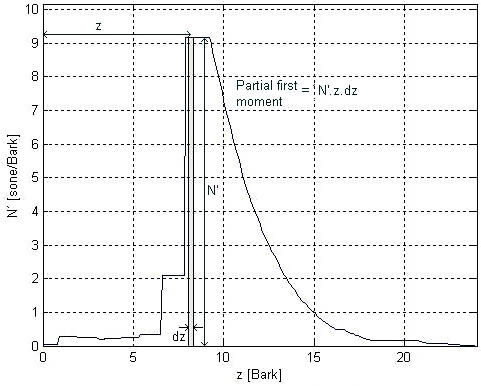
Fig 2. Calculating the sharpness
Zwicker and Fastl [1] define a sound of sharpness 1 acum as ‘a narrow band noise one critical band wide at a centre frequency of 1kHz having a level of 60dB’. However, sharpness is a metric which has not yet been standardised. Consequently there are several methods to calculate the metric including: Von Bismarck’s method [2] which introduces the idea of a weighted first moment calculation, Aures’s method [3], which is a modified version of Von Bismarck’s equation and Zwicker & Fastl’s method [1] which is a version of Von Bismarck’s equation with a modified weighting curve.
Using Zwicker and Fastl’s [1] approach sharpness can be calculated as the weighted first moment of the specific loudness (N’). The calculation of a partial first moment at z is N’.z.dz (shown in figure 2). This partial first moment is then weighted by the function g'(z) to give g'(z).N’.z.dz. The sum of these weighted partial moments is calculated. This is then divided by the total loudness (N):
[N = int_0^{24Bark} N’ dz]
and multiplied by a proportionality constant (c=0.11) to give the following value for sharpness (S):
[S = c cdot{ int_0^{24Bark} N’g'(z) cdot z cdot dz over int_0^{24Bark} N’ dz}]
where:
[left{ begin{array}{l }z< 14,rightarrow g'(z) = 1 z< 14,rightarrow g'(z) = 0.00012cdot z^4 – 0.0056 cdot z^3 + 0.1cdot z^2-0.81cdot z + 3.51 end{array} right}]
In the calculation dz can be approximated by 0.1 Bark. The values of the weighting function, g'(z) employed by Zwicker and Fastl [1] are shown in figure 3.
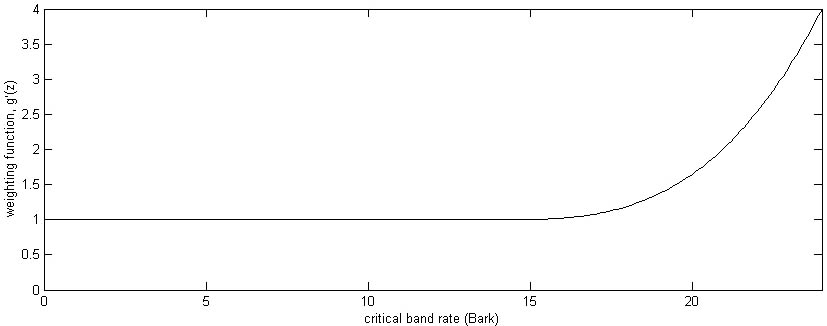
Fig 3: Weighting, g'(z), as a function of critical band rate
Booming
The method of calculating the booming index is similar to that of calculating sharpness. However, booming is a measure of the low frequency content of a sound rather than high frequencies; the greater the proportion of low frequencies the greater the ‘booming’ sound. So booming can be considered to be the opposite of the sensation of sharpness. Booming is a useful metric in the automobile industry [4, 5]; it is used to partially quantify the sound quality of engine noise. In this case the booming sound of an engine is thought to relate specifically to the engine harmonics. So a method of calculation proposed by Hashimoto makes use of the ‘order’ analysis of a sound, relating the sound from the source to the revolution speed or r.p.m. of operation. From this the fundamental frequency and harmonics can be determined and the loudness of these calculated.
The booming index can then be calculated by weighting these low frequency elements using the following weighting function (fig 4) and comparing them with the loudness in the rest of the spectrum:
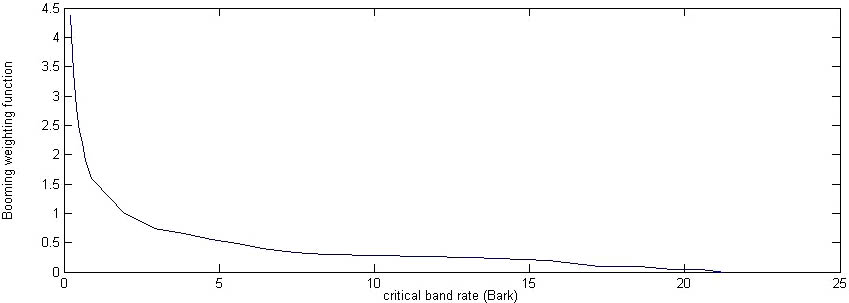
Fig 4. Booming weighting as a function of critical band rate
References
[1] Zwicker E, Fastl H, ‘Psychoacoustics: Facts and Models’ (Springer 1990)
[2] Von Bismarck, G. ‘Sharpness as an Attribute of the Timbre of Steady State Sounds’, Acustica 30 pp 159-172, (1974)
[3] Aures, W. ‘Berechnungsverfahren für den sensorischen Wohlklang beliebiger Schallsignale’ (A model for Calculating the Sensory Euphony of Various Sounds) Acustica 59, pp 130-141 (1985)
[4] ‘Sound Quality Evaluation of Non-stationary Noise and Its Application to Vehicle Booming Noise’ Shin Sung-Hwan PhD thesis, (2004)
[5] ‘An objective Approach to Vehicle Internal Noise Assessments’, MF Russell, Noise and the Automobile, Selected papers from Autotech ’93